
Picayune, Ms Residential Real Estate Market Report
Through December 31, 2025 (updated 1/23/2026)
Below is the current residential real estate market report for Picayune, Ms and the surrounding areas. This data was collected and assembled by Lee Thomas of Core Alliance Realty, from the Pearl River Board of REALTORS (PRBOR) Multiple Listing Service (MLS). This data represents all residential sales that were listed or sold by a member of the PRBOR. It does not include properties that were for sale by owner (accuracy + or -5%).
The market we're in now
Properties currently on the market 210
Properties sold in the last 12 months (1/1/2025-12/31/2025) 564
564 divided by 12 month is = 1.54 homes sold per month in the previous 12 months
210 available homes divided by 1.54 = 136 days supply on the market
136 divided by 30 = 4.5 months supply on the market
-
Seller's Market: 0 to 5 months supply of homes
-
Neutral Market: 5 to 6 months supply of homes
-
Buyers Market: More than 6 months supply of homes
24 Month Comparison
This report compares changes in the Picayune real estate market in the previous 24 months (January 1, 2024 to December 31, 2024 and January 1, 2025 to December 31, 2025)
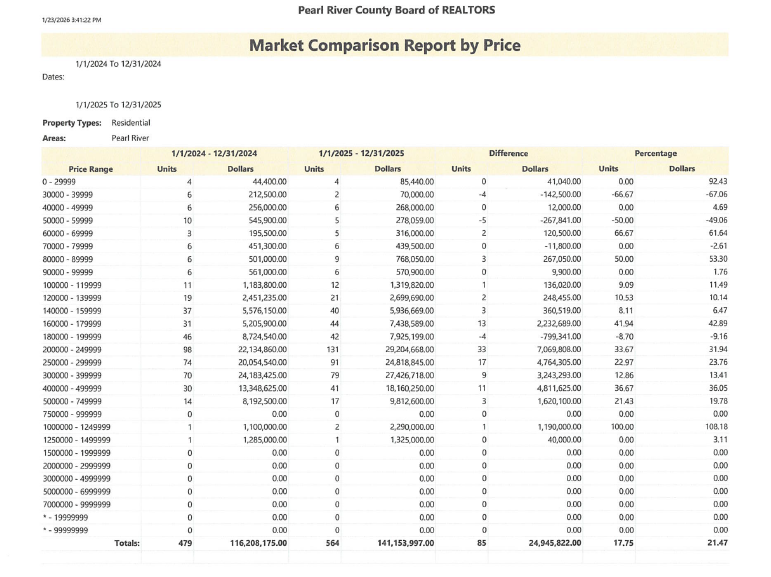
The previous 12 months saw increase in sales of $24,945,822.00 representing a 17.75% increase in the number of units sold and a 21.47% increase in the dollar volume of units sold
The median price range remains in the $200,000.00-$249,999.99 range with 131 units sold.
The highest dollar volume increase was in the $200,000.00-$249,999.99 range with a substantial increase from 96 to 131 units sold. An increase of 33.67% in the number of units sold and a 31.94% or $7,069,808.00.00 increase in dollar volume closed.
The biggest change was in the $1,000,000.00 to $1,250,000.00 range with and increase of 100% from 1 unit sold in 2024 to 2 units sold in 2025.
The largest decrease was in the $30,000.00 to $39,999.99 range with a decrease of 66% from 2024 to 2025. This was likely due to the lack of availability of residential properties in that price range.
If you would like receive quarterly market reports like this one in the future click here.